Friendly Web App Wanted
Now it is the time to start playing with data we have collected. We need some nice, simple, user friendly web application which will be both easy to use and maintain.
I thought it can help me that I was some time web developer in late 90s. But honestly, I was terrified what happened with web development in past years.
The time when the developer was in full control of his code using html, css, javascript and some server technology like ASP or PHP are definitely gone. Now it sounds completely unrealistic that it was once possible to develop the brand new e-shop or booking system from scratch within couple of days.
Where are the Good Old Days..
Now just the setup of development environment takes several days. Considering you already made all your decisions about technologies, libraries, frameworks and work flow methodology. There are thousands of dependencies, several layers of abstraction, in fact you never directly touch the final html code and you need special tools to compile and deploy the web application. Holy shit! I am completely lost.
I definitely don’t want to waste my time reinventing the wheel, but also have hard time to accept using Megatron’s dark matter beam to get rid of one clothes moth, and spending half of my life and all money doing so.
Google Polymer
In fact I don’t care what tool to use, just if it works and I can focus on «what» I want, not «how» to get it.
Monica in the following video convinced me that Google Polymer is what I need. Specially the key word «lazy developer» got my full attention.
And so far it seems she is right. Of course the cost is being terribly dependent on work of someone else. But that’s life.
Development Environment
We need NODE.JS and POLYMER CLI to get the app template for quick development start. You can follow instructions in this post to get some more background.
Then login to firebase.com using your google account. Here we get for free real-time database and web hosting.
To be able to use Firebase hosting it is necessary to install Firebase CLI
Firebase Database
In the prior post we have prepared the job generating delta update of Firebase database personal_dwh/weather_mart/jobs/nodejs/lubolab_delta.js. Here you can see how such delta looks like.
{"Measures":{
    "Weather":{
        "Temperature":{
            "Yearly":{"2017":["2017",-17.5,7.3,-2.3263446484606]},
            "Monthly":{"201702":["2017-02",-3.6,7.3,0.1741902861111]},
            "Daily":{"20170209":["2017-02-09",-3.6,0,-2.18654409]},
            "Hourly":{"2017020900":["2017-02-09 00",-3.3,-3.3,-3.3],
            "2017020901":["2017-02-09 01",-3.5,-3.3,-3.36271],
            "2017020902":["2017-02-09 02",-3.5,-3.4,-3.44915],
            "2017020903":["2017-02-09 03",-3.5,-3.4,-3.40339],
           }},
        "Rain":{"Yearly":{"2017":["2017",18.3]},
            "Monthly":{"201702":["2017-02",11.6]},
            "Daily":{"20170209":["2017-02-09",0]},
            "Hourly":{"2017020900":["2017-02-09 00",0],
            ...
            ...
The whole database is following the same pattern, it contains the full history, not just the fragment as our delta. That’s the data which our app is going to consume.
Required Business Logic
The app will present some particular data, like Hourly Temperature, for specified period of time.
So we need to specify the path to proper data set like Weather/Temperature/Hourly And the filtration criteria like Starting Hour and Ending Hour.
Being able to query the data, we just need one more component for data visualisation.
Seems like our needs are pretty clear, let’s pick some Lego bricks from Google Polymer and put it all together.
App Skeleton
It’s going to be one page app. Starting with Polymer CLI we have the app template ready. There is one html page index.html fixing for us the rocket science issues of modern web app. I really don’t bother trying to understand them.
Once we create our own web component as described below, we simply put it’s tag data-lab to the body of index.html
  <body>
    <data-lab
     project="lubolab"
     title="LuboLab"
     database="lubolab-957a1"
     apikey="AIzaSyAzCWyUgRvzS3KRA-4t4DEK8FloYH_PAF4"
     ></data-lab>
  </body>
The data-lab web component is kind of envelope for our app. It is derived from the app component provided by Polymer CLI which fixes app routing and provide top navigation menu for the app. I added there two Firebase elements, first one providing the connection to the Firebase, second one, the user authentication. Then some icon showing whether network is connected and button to sign in. As authentication provider I picked Google, so you need Google account to login. And finally the round green button with plus sign, related to our second web component which defines the data Card. The green button is adding one more Card to the page.
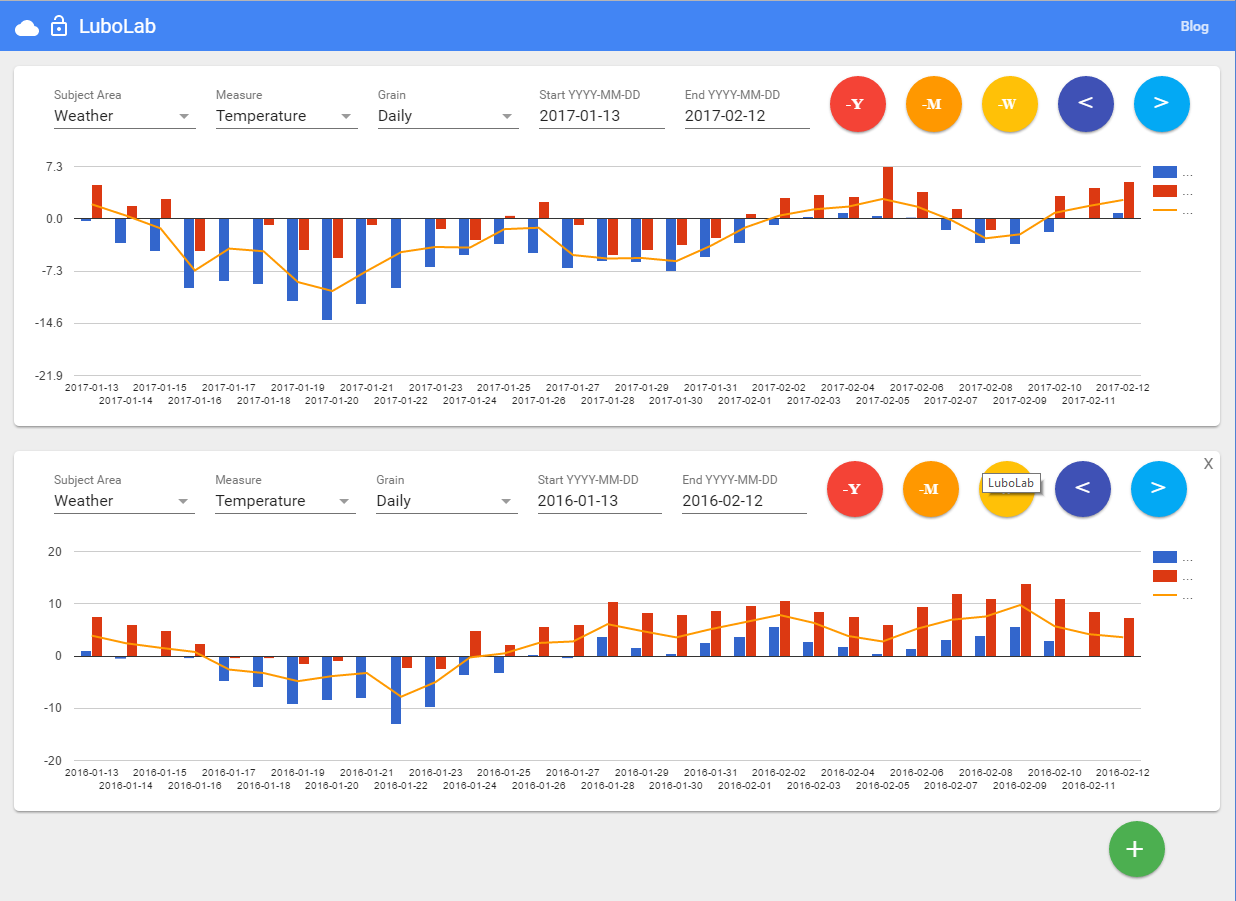
The data-view web component (the data Card) contains our core business logic. Basically it’s a card showing the data, based on our choice. We can place more cards on one page (using the round green button mentioned earlier) to compare the same measure for different periods or different measures for the same period. Or whatever combination we like. This component is composed of several elements. Invisible firebase-query element which takes the inputs from a set of dropdown-menus specifying the Measure and data Grain, and two simple inputs for period Start and End. And then the main visual element google-chart, visualising the data received from firebase-query. And finally the set of coloured navigation buttons to move in time through the data.
Of course it was necessary to create several JavaScript methods controlling mentioned elements. The only complication was, for me, a bit unexpected behaviour of firebase-query element. It delivers data bit by bit, in iterations, and to avoid repetitive reloading of Google Chart, it is better to pre-calculate the number of expected data sets, and only send the data to Google Chart when the data delivery is finished.
You can try the final result here lubolab-957a1.firebaseapp.com Google account is required to login. The weather data is available for any Google user. Just click the LOGIN button at the top left. Tested OK with Chrome, Edge, Safari. Doesn’t work with IE. No clue about the rest.
The Final Code
The final code is available in public repository on GitHub personal_dwh
personal_dwh/web_app check the master branch.
the objects mentioned when talking about the App Skeleton:
personal_dwh/web_app/public/index.html
personal_dwh/web_app/public/src/data-lab.html
personal_dwh/web_app/public/src/data-view.html
Get it Running
To get the app running on your local computer, just change the path according to your local GitHub repository location.
cd C:\Users\Lubomir\Desktop\GITHUB\personal_dwh\web_app\public
polymer serve
And then to get it running on the Firebase hosting location
cd C:\Users\Lubomir\Desktop\GITHUB\personal_dwh\web_app
firebase login
firebase deploy