Welcome to the Cloud
In the first post I have stated that any cloud SQL service is still too expensive comparing to other options. As long as that assumption was only living in my head it was doing pretty well. But once it was written, things changed dramatically. The questions start raising.
As a consequence there was long chain of events starting with detail investigation of Google Cloud SQL prices, testing the smallest SQL instance and discovering the whole new world of options.
Dynamic Data Mart
Then, instead of just copying my existing code of Weather data mart to the GitHub repository and describing it, I started completely new development of dynamic solution. No more physical tables, everything just as view.
The final code is available in public repository on GitHub personal_dwh
personal_dwh/weather_mart check the master branch.
The Adjustments
The weather datamart brings the weather data in hourly/daily/monthly/yearly views. Part of the data mart are also the adjustments. As I have already mentioned in the prior post, in detail layer we always keep data as it comes from the source. Even if we find data quality issues which cannot be fixed by redelivering data from the source, we still don’t fix the error in the detail layer. But instead introduce adjustments in our data mart.
We can introduce adjustments in any used time context, so as hourly/daily/monthly/yearly adjustments. Of course the adjustment defined on lower level moves accumulated to the higher level. No need to define the same adjustment separately for each time context. Adjustments tables are defined here:
personal_dwh/weather_mart/db/tables
Some Small Additions
Well, the Google Cloud SQL is still just MySQL database which was never strong in analytical SQL functions. And anyway with the smallest SQL instance we don’t have the power for any advanced SQL kung fu. We need to keep things simple.
So we need one derived table with pre-calculated Actual Rain. The Rain comes from the source as Total Rain figure, the total accumulation from the beginning of the measurement. In the pre-calculated table we store the increase of Total Rain comparing to the prior value. See the all related code in the repository.
The table definition is here:
personal_dwh/weather_mart/db/tables/t_actual_rain.tbl
And the procedure loading the table here:
personal_dwh/weather_mart/db/procedures/sp_load_actual_rain.sp
The procedure is now called from the job each time the detail table is loaded.
personal_dwh/detail_layer/jobs/powershell/weather_rupload.ps1
The Big Picture
OK, now is the time to put all the thing together and show how it works
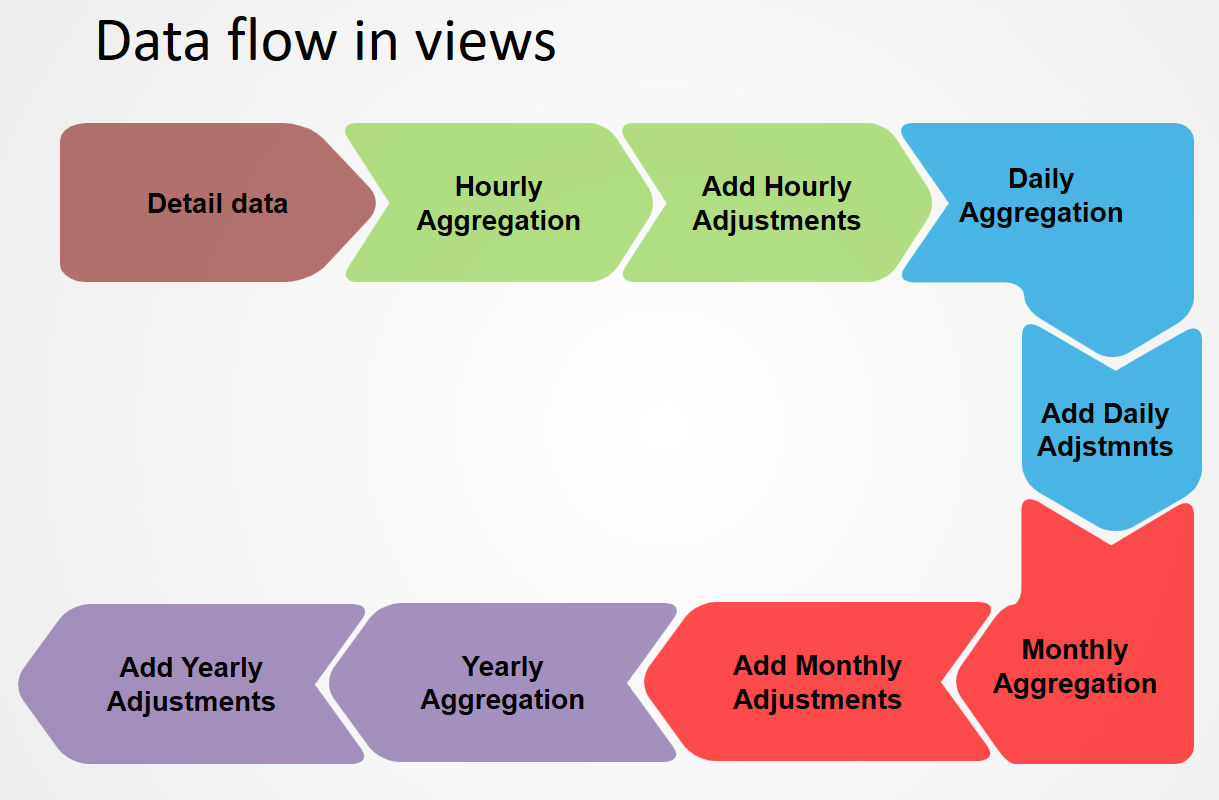
That’s the logical picture. It is a bit naive, assuming that we can always filter the needed data simply in the final view we use. Of course we can, the only problem is performance.
In the next post we will finally focus on the reporting layer. It will be web component consuming json data. To simplify things, and get real-time database experience for the end users, we will use Firebase.
So the last thing we need now is performance tuning of our views focusing on updates of Firebase database.
In some short regular intervals, say each 10 minutes, we need to update all values impacted by latest measurement.
To update all figures for actual Hour, actual Date, actual Month, actual Year. This list in fact defines the needed data scope for our views.
Performance Tuning
In practise we keep just 3 data scopes: actual Date, Month, Year and always update all hours for actual Date.
We can derive all that scopes from the value of actual Date which we store in table as Day_Id defined as integer YYYYMMDD
personal_dwh/weather_mart/db/tables/t_loaded_periods.tbl
Then on our datamart lowest level of detail we need 3 views:
personal_dwh/weather_mart/db/views/v_all_measures_hourly4day.vw
personal_dwh/weather_mart/db/views/v_all_measures_hourly4month.vw
personal_dwh/weather_mart/db/views/v_all_measures_hourly4year.vw
Where the data scope for each time context is defined by inner join to mentioned table. See the variations of the join for the Day, Month, Year:
INNER JOIN
    pdwh_mart_weather.t_loaded_periods tm
    ON DATE_FORMAT(wm.`Datetime`, '%Y%m%d') >= tm.Day_Id
INNER JOIN
    pdwh_mart_weather.t_loaded_periods tm
    ON DATE_FORMAT(wm.`Datetime`, '%Y%m') >= LEFT(tm.Day_Id,6)
INNER JOIN
    pdwh_mart_weather.t_loaded_periods tm
    ON DATE_FORMAT(wm.`Datetime`, '%Y') >= LEFT(tm.Day_Id,4)
You can find all the views in mentioned repository at location:
personal_dwh/weather_mart/db/views
The Final Query
Using this approach, even with the smallest SQL instance the response time to get all actual values for the update is just few seconds, without used data elimination the response time with actual almost 6 years history in data was several minutes. The final query which is part of the job mentioned later is like:
SELECT "Yearly" AS Grain, Year_id AS Period, Outdoor_Temp_MIN, Outdoor_Temp_MAX, Outdoor_Temp_AVG, Actual_Rain, Relative_Pressure_MIN, Relative_Pressure_MAX, Relative_Pressure_AVG, Outdoor_Hum_MIN, Outdoor_Hum_MAX, Outdoor_Hum_AVG, Dewpoint_MIN, Dewpoint_MAX, Dewpoint_AVG, Wind_Speed_MIN, Wind_Speed_MAX, Wind_Speed_AVG FROM vs_all_measures_yearly4year'
UNION ALL
SELECT "Monthly" AS Grain, Month_id AS Period, Outdoor_Temp_MIN, Outdoor_Temp_MAX, Outdoor_Temp_AVG, Actual_Rain, Relative_Pressure_MIN, Relative_Pressure_MAX, Relative_Pressure_AVG, Outdoor_Hum_MIN, Outdoor_Hum_MAX, Outdoor_Hum_AVG, Dewpoint_MIN, Dewpoint_MAX, Dewpoint_AVG, Wind_Speed_MIN, Wind_Speed_MAX, Wind_Speed_AVG FROM vs_all_measures_monthly4month'
UNION ALL
SELECT "Daily" AS Grain, Day_id AS Period, Outdoor_Temp_MIN, Outdoor_Temp_MAX, Outdoor_Temp_AVG, Actual_Rain, Relative_Pressure_MIN, Relative_Pressure_MAX, Relative_Pressure_AVG, Outdoor_Hum_MIN, Outdoor_Hum_MAX, Outdoor_Hum_AVG, Dewpoint_MIN, Dewpoint_MAX, Dewpoint_AVG, Wind_Speed_MIN, Wind_Speed_MAX, Wind_Speed_AVG FROM vs_all_measures_daily4day'
UNION ALL
SELECT "Hourly" AS Grain, Hour_id AS Period, Outdoor_Temp_MIN, Outdoor_Temp_MAX, Outdoor_Temp_AVG, Actual_Rain, Relative_Pressure_MIN, Relative_Pressure_MAX, Relative_Pressure_AVG, Outdoor_Hum_MIN, Outdoor_Hum_MAX, Outdoor_Hum_AVG, Dewpoint_MIN, Dewpoint_MAX, Dewpoint_AVG, Wind_Speed_MIN, Wind_Speed_MAX, Wind_Speed_AVG FROM vs_all_measures_hourly4day'
And here you can find simple node.js script updating the Firebase:
personal_dwh/weather_mart/jobs/nodejs/lubolab_delta.js
Next time we will finish the first building block of personal data warehouse by making weather data available in a web app.